
Tools
Parts
No parts specified.
-
-
Open your browser and browse to https://analytics.umd.edu
-
UMDashboards is best viewed in the Google Chrome browser.
-
-
-
Click the red UMDashboards button in the header of our website to open UMDashboards.
-
You will be redirected to CAS. Log in & complete your Duo push to continue.
-
After you authenticate through CAS, you may be presented with an interstital page asking whether you want to view dashboards in HTML or Flash.
-
Choose Enable Flash to continue.
-
Choose Allow in the following prompt that appears in the top left.
-
You will now be logged in to UMDashboards. Depending on your settings, you will see one of two landing screens.
-
-
-
Depending on your settings, you will either see:
-
1. The Startup Dashboard you have configured in your user settings or that has been assigned to your user profile by a member of our team.
-
2. The default iDashboards landing screen (which is blank).
-
-
-
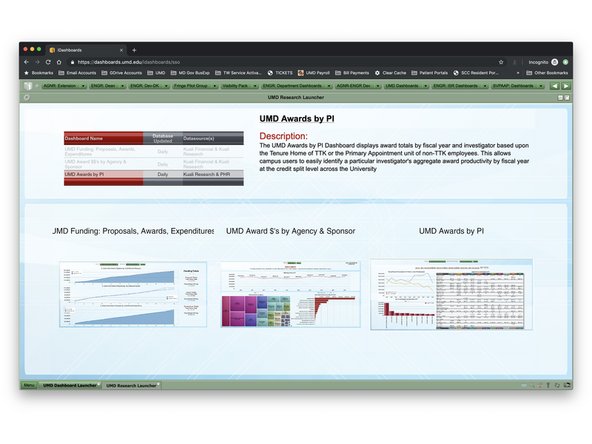
UMDashboards is set up using a system of launchers and sub-launchers.
-
Launchers exist at the root level of a dashboard category, as in the first picture.
-
Sub-launchers exist one or more below the launcher level, as in the second picture.
-
Dashboards (where the data lives) exist below the sub-launcher level, as in the third picture.
-
To get to a dashboard, you navigate using a drill-down approach from launcher to sub-launcher to dashboard.
-
-
-
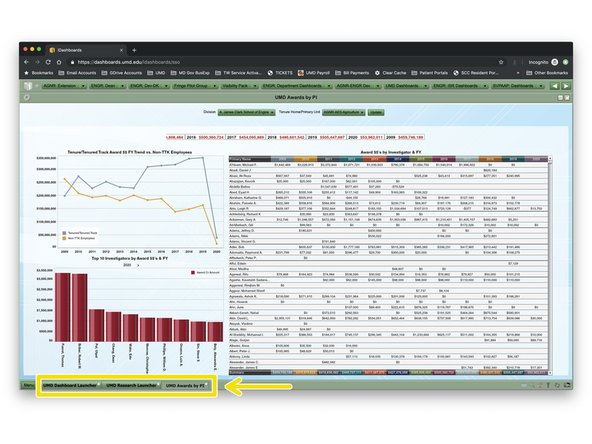
When attempting to go back to the previous launcher, sub-launcher, or dashboard, never use your browsers back button.
-
Instead, click on the tabs located at the bottom of the screen to visit the previous screen you were on.
-
Pro tip: these tabs are similar to windows on your computer. iDashboards opens a new tab for each dashboard you visit. You can jump between any of your previous dashboards at any time.
-
-
-
Pro tip: most, if not all of our dashboards are interactive. We encourage you to click around and explore.
-
Hover your mouse over various parts of a chart to determine interactivity.
-
Some charts will include interactive intelligence and highlight parts of another chart when you hover, as in the first picture.
-
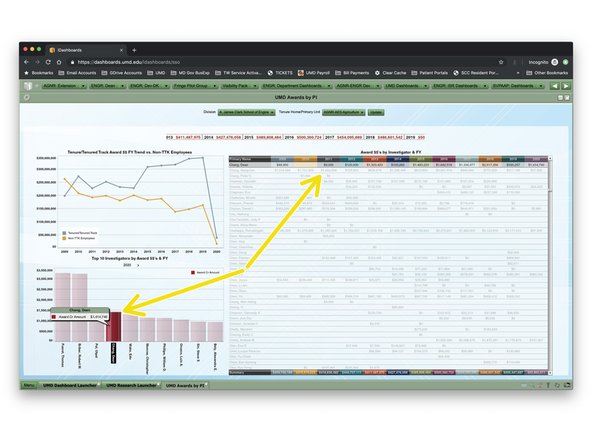
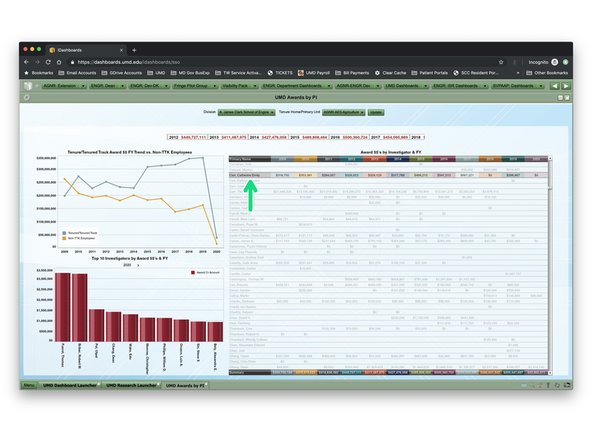
Some charts allow you to drill-down into further details about a specific data point.
-
Drill-down functionality is available when your cursor changes to a hand pointer when hovering over a chart.
-
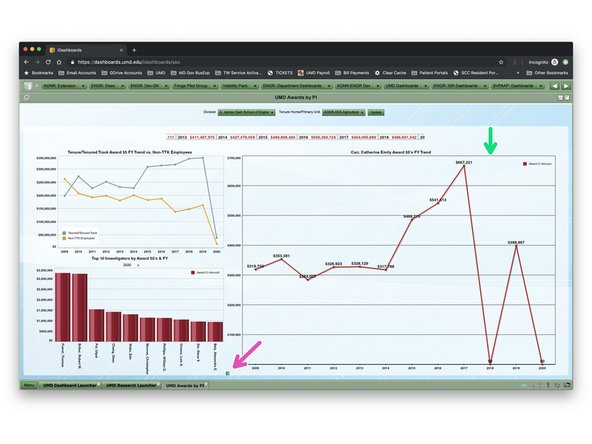
Simply click to drill-down. The second picture shows the record to be drilled and the third picture shows the resulting chart after drill-down.
-
To drill back up, look for a green return arrow icon in the lower left of a chart, as in the third picture.
-
-
-
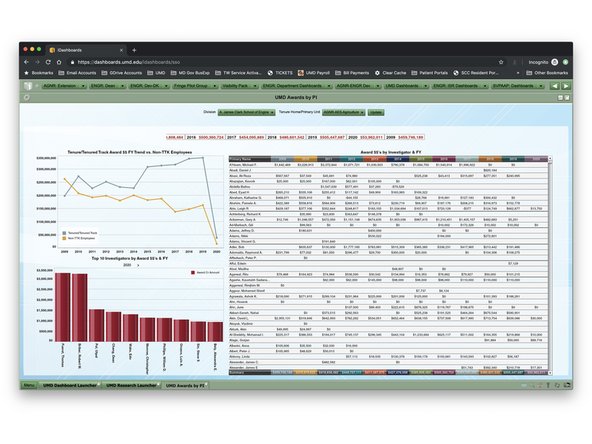
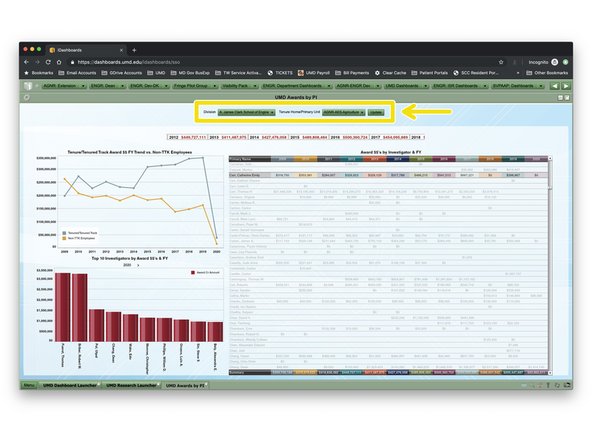
Many of our dashboards allow you to filter data to make it relevant to you personally.
-
Filters are called dashboard parameters and are usually available via dropdowns at the top of a dashboard, as in the first picture.
-
Many of our filters use the same logic. You will usually find a division filter, department filter, and sub-department filter.
-
In this example (the UMD Awards by PI dashboard), data can be filtered by Division and Tenure Home / Primary Unit of the faculty member.
-
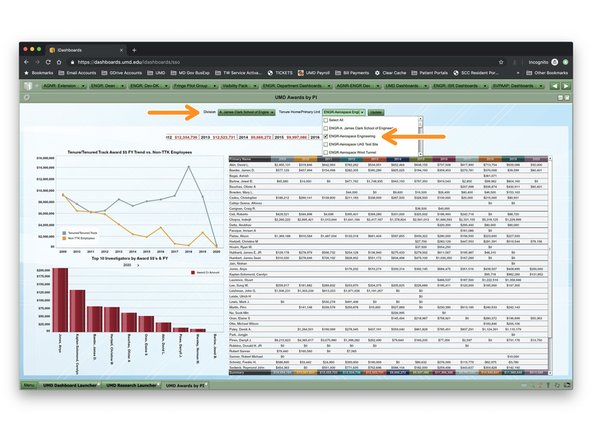
In the second picture, I've filtered the data to Engineering using the Division filter and Aerospace Engineering using the Tenure Home / Primary unit filter.
-
Many filters allow you to select more than one value, useful to see multiple units on one dashboard.
-
-
-
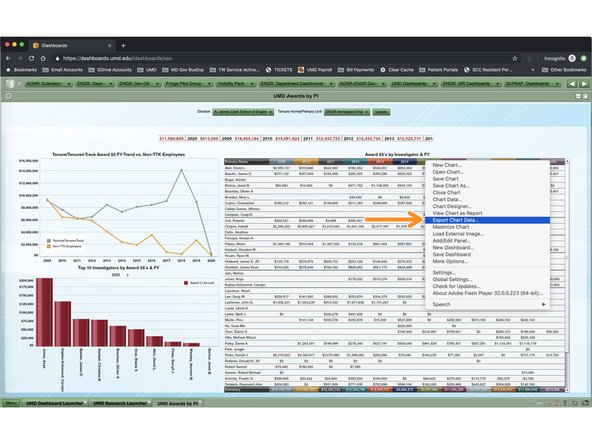
When you find data on a dashboard you want to analyze in a different way than we have presented it, you can quickly export it into a csv file for your own analysis.
-
To export data, simply right-click on the chart you would like to pull the data from and select the Export Data option in the corresponding menu.
-
The data will download to your computer in a csv file titled after the chart name and can be used in any program that will read csv files, including Microsoft Excel.
-


You’re now a UMDashboards expert!
You’re now a UMDashboards expert!