
-
-
Before any height measurements are made, it is best practice to define the "0" level of the object.
-
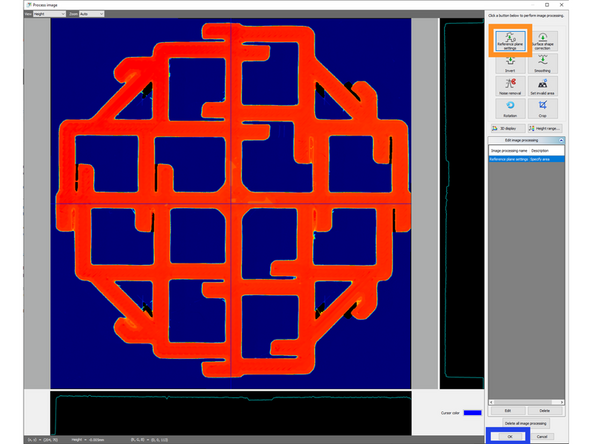
The image pre-processing can be accessed in the top left
-
There are many many sub-options in here that are worth exploring, but these modify the existing data. Therefore, we will not be exploring them in this tutorial.
-
The Reference Plane tool can be accessed from the top left OR from inside the image pre-processing menu
-
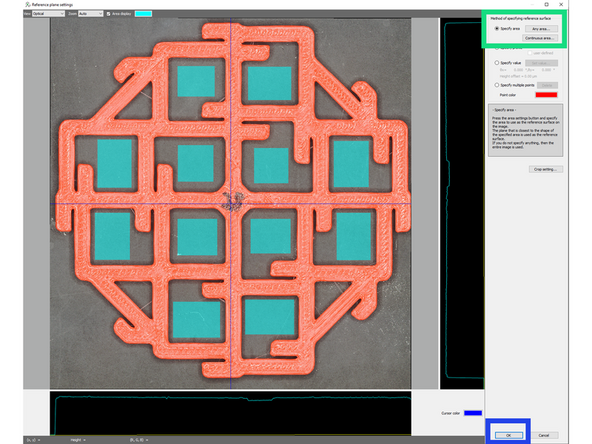
There are multiple methods to define the reference plane- "specify an area" is the most useful due to it sampling multiple points.
-
Manually defining the plane with "specify profile", "specify value", or "specify points" is possible, but not strongly recommended.
-
After selecting an area as your "zero" (normally, this is the plate- This may change for your sample, however), select "ok" and then "ok" again to apply the change.
-
-
-
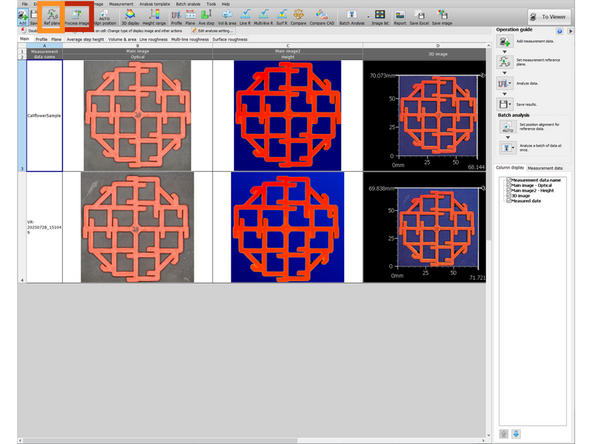
The analyzer software is used to analyze the scan results
-
Its features include: display 3D view, adjust height range, cross-section view analysis, part measurement, surface roughness analysis, part comparison, part to model comparison
-
These features can be found in the top toolbar when the analyzer software opens
-
-
-
Select 3D Display from the top toolbox
-
Here you can see the 3D display of the scanned part with dimension in all 3 axes
-
The color represents the depth measurement
-
The color range can be adjusted by going to Height Range from the top toolbox
-
-
-
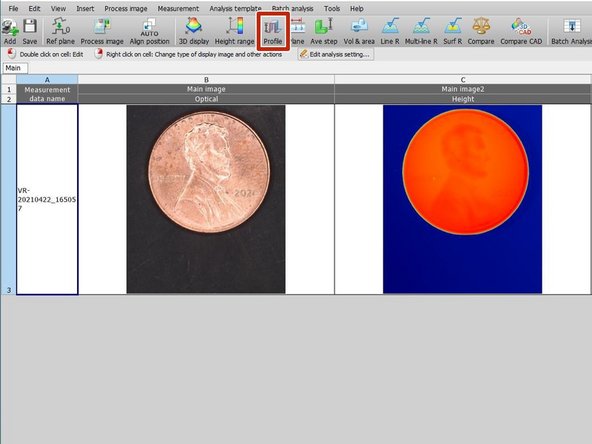
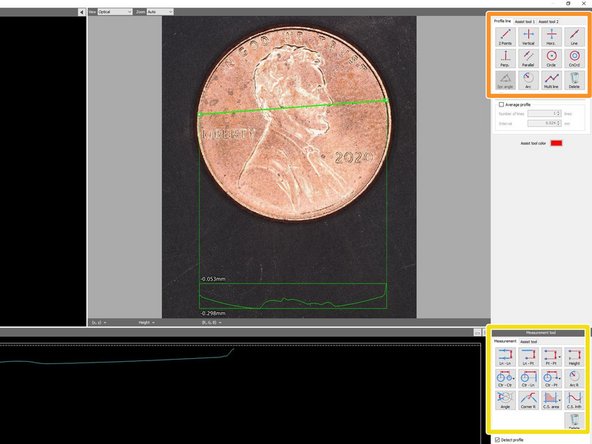
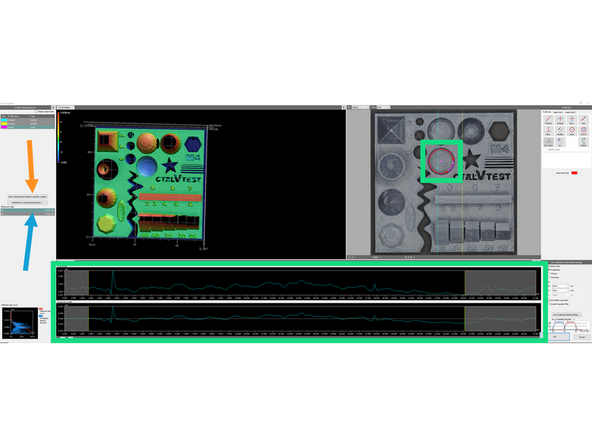
Select Profile from the top toolbox
-
This tool creates height profiles along lines defined by the user- otherwise known as a "cross section"
-
Select which profile line you want and place it on the 2D view of the scan object
-
The cross section view will automatically update when a line is moved
-
Multiple lines can be defined at a time, but only a single selected one will be shown in the bottom window.
-
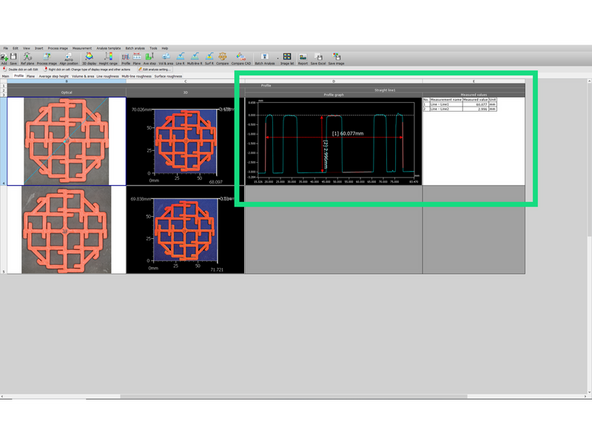
The bottom window can be used to define measurements of the cross section created by the line.
-
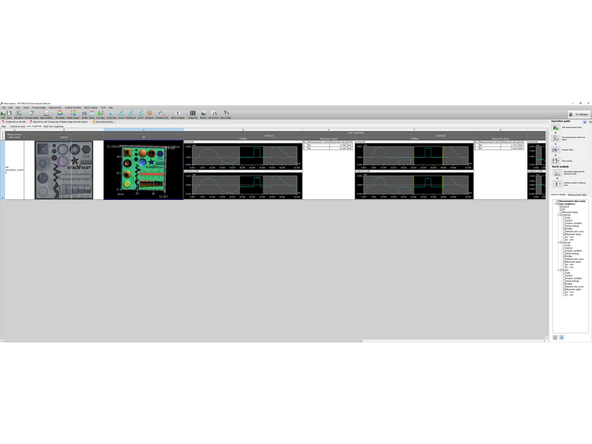
The final results are shown in a separate sheet with the cross section and the user defined measurements.
-
-
-
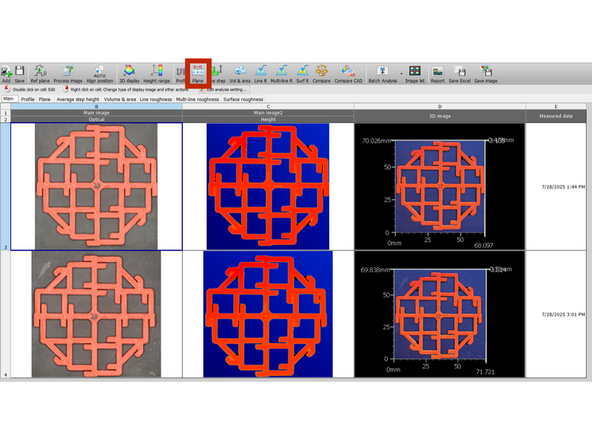
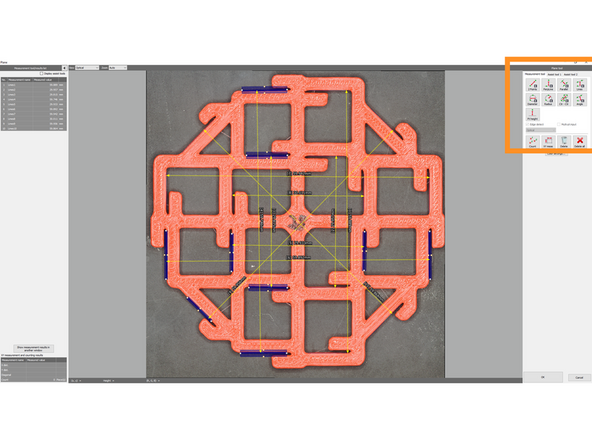
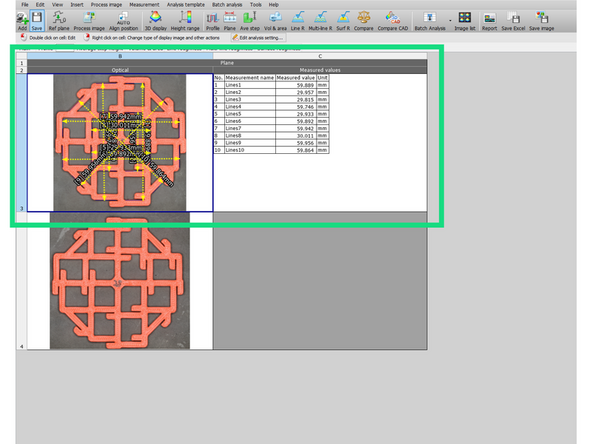
The "Plane" tool allows definition of 2d measurements.
-
In order to take any measurement data, features have to be defined using user defined features or assist tool defined features.
-
All measurements are placed in a table that is visible on the results page (the table may have to be expanded to be fully visible)
-
-
-
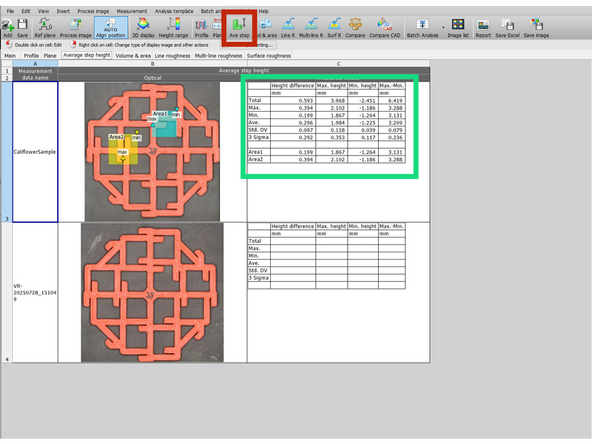
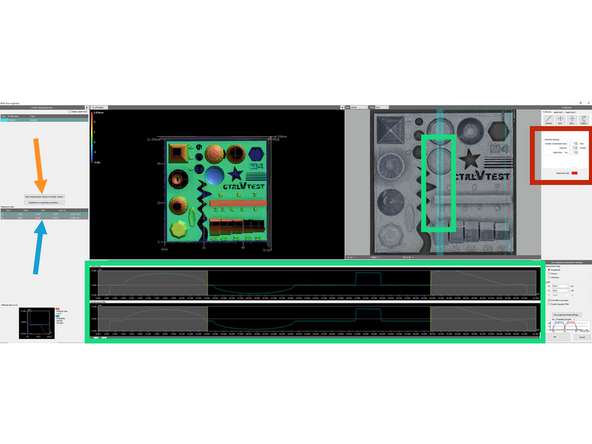
The Avg. Step tool can be accessed by clicking the "Avg. Step" block on the top toolbar.
-
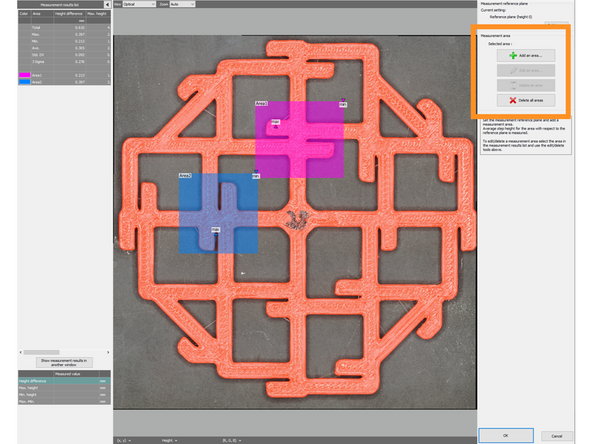
This tool finds the highest and the lowest height measurement for a user-defined area, and if used with multiple areas it will calculate statistics for the differences between each max and min.
-
To start measuring the step in an area, select "add an area" and use the area definition tools (detailed in "assist tools" dozuki guide)
-
The results from the area measurements are presented on the left side of the menu, as well as in a table in the overall sheet.
-
-
-
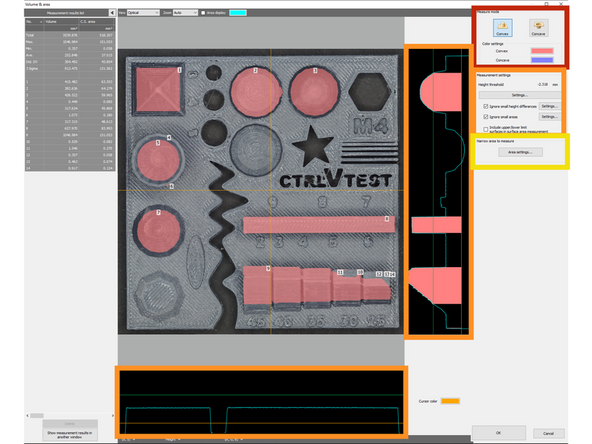
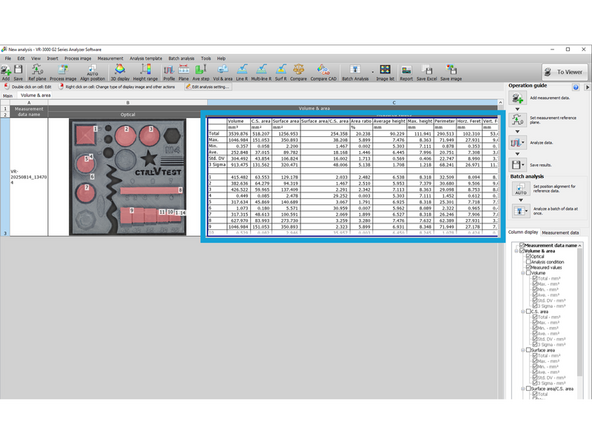
The volume and area measurement tool can be accessed on the top bar similar to the other tools, and can be used in interesting ways to measure volume and surface area of specific sections defined by the user.
-
The right side has multiple tools that change the type and scope of the measurement to be made.
-
The mode can be changed between convex and concave, and will change what volume is being measured based off of the height limits.
-
The height limits can be modified either with the option box on the side or by moving the lines in the bottom or right profile preview (these preview panes can also be used to visualize what volume is being measured)
-
The area being measured can also be specified, with the "narrow area to measure" option.
-
This tool uses the traditional 2d area selection toolset, and the volume being measured can be previewed with the side windows.
-
The chart on the left will display in the main sheet, and will show statistics with all isolated "islands" of volume measurement, as shown in the preview windows. (this table can be larger than the preview box)
-
Use the numbers in the image to best understand where certain areas are, and whether to keep or eliminate them.
-
-
-
There are two similar tools here, Single Line Roughness and Multi-line Roughness. Either can be selected on the top bar with the other analysis tools.
-
With single line roughness, lines can be defined similarly to the "Profile" tool, including assist tools.
-
Multiple lines can be defined- only the selected one will be shown on the chart on the bottom, but all will be shown in the main sheet. Each line is named and numbered on the left side chart.
-
Multi-line roughness shares the analysis window and parameter definition of the single line roughness tool, but instead only allows definition of straight lines, where it then creates multiple parallel lines to draw statistics about surface roughness of the region.
-
The lines are defined similarly to other lines, but also have extra parameters to control how many extra lines on each side there are, how far apart they are, and which line is used for the chart preview.
-
Roughness parameters can be added or removed with the corresponding button on the left side
-
The area being measured can be edited on the bottom window- areas highlighted in gray are excluded from surface roughness calculations. (this selection will be reflected by the red line with an X on each side in the selection window)
-
All statistics are shown on the main sheet, in addition to the chart on the left side of each editing window
-
-
-
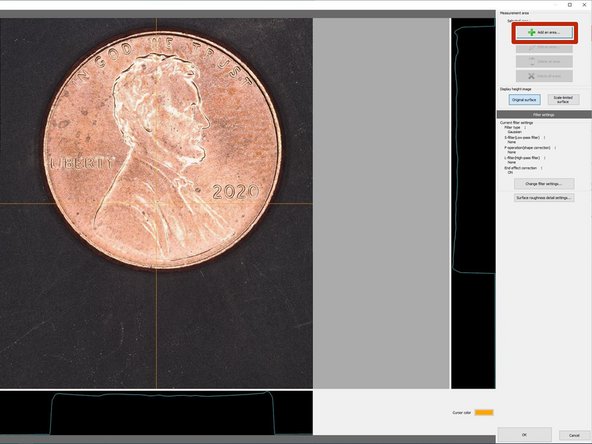
Select Surf R from the top toolbox
-
Here you can measure the roughness of a surface
-
Select Add an area in order to select the area to measure
-
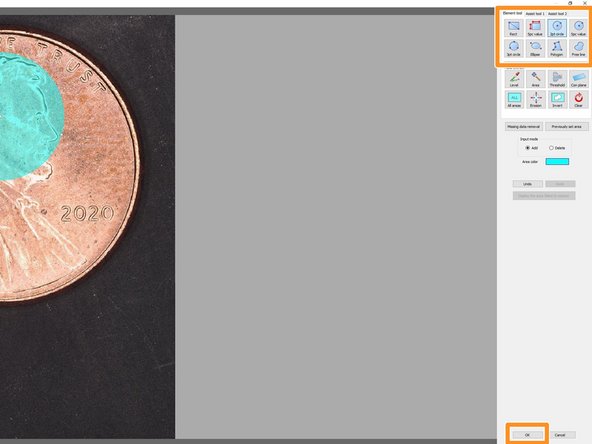
Select the area you want to measure with whatever shape you need and select Ok
-
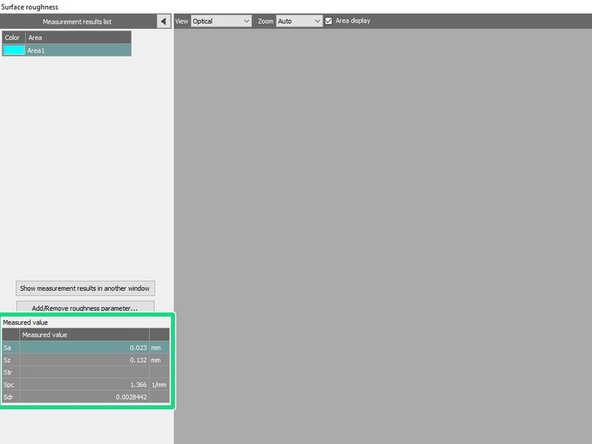
The software will automatically measure the arithmetic mean height (Sa), maximum height (Sz), texture aspect ratio (Str), etc and show those measurements in the left window
-
You can add, edit, or delete areas by selecting the appropriate box from the top right and following the same process as before
-


Cancel: I did not complete this guide.
One other person completed this guide.
