
Introduction
This is an advanced tutorial for Keyence Microscopic 3D scanner. The tutorial teaches how to scan object which require different focus level and how to perform part to part or part to CAD comparison. The tutorial assume that the users have completed the beginning tutorial and have sufficient skill to operate the scanner.
-
-
This guide will be divided into three sections
-
The first section will teach you how to perform scan on object which require different focus points
-
The second section will teach you how to perform part to part comparison using the Analyzer software
-
The third section will teach you how to perform part to CAD comparison using the Analyzer software
-
-
-
The first section will explain how to scan an object which has features with different height (See the first figure)
-
Challenge: You will need different focus to scan different feature of the object
-
Scanning section with elevated height will require to set a high focus point
-
Scanning section with low height will require to set a low focus point
-
The automated stitching explained in the previous guide can only perform scan under one focus point
-
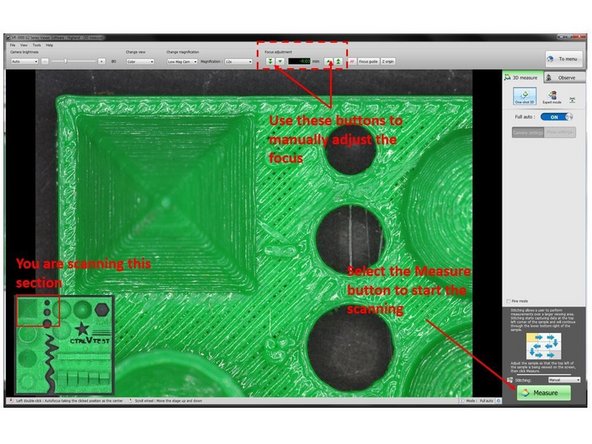
To allow for focus point modification between scans, you will need to set the stitching to manual (See the second figure)
-
The stitching start capturing data at the top left corner of the sample and will continue through the bottom right of the sample (See the third figure)
-
To begin the scan, place the object so that the top left corner as shown in the screen (See the third figure)
-
-
-
Set the part so that the top left of the part is shown in the screen (As shown in the first figure)
-
As the part consist of structures with different height, you will need to be careful with the focus point
-
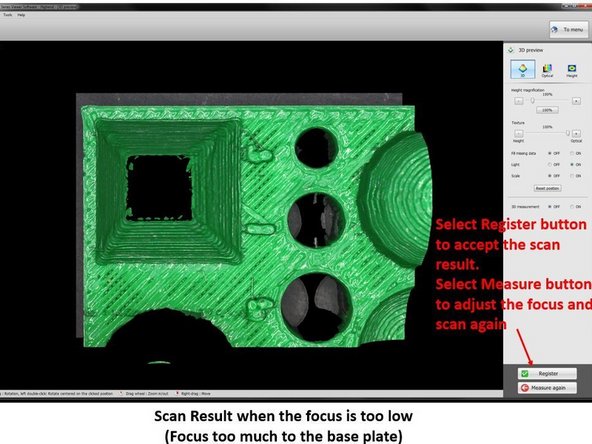
If you set the focus point too low, only the section with low elevation will be scanned (See the second figure)
-
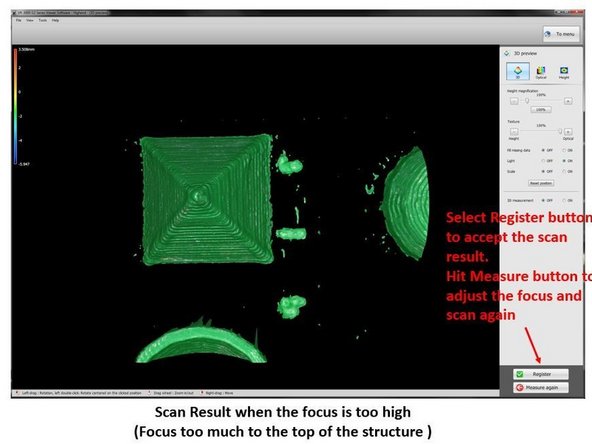
If you set the focus point too high, only the section with high elevation will be scanned (See the third figure)
-
You can adjust the focus point manually via the Focus adjustment feature in the top window
-
For this scan you will need to have the focus adjustment around 7.5 to 8.5. You can run different scans with various focus point to find the optimum point
-
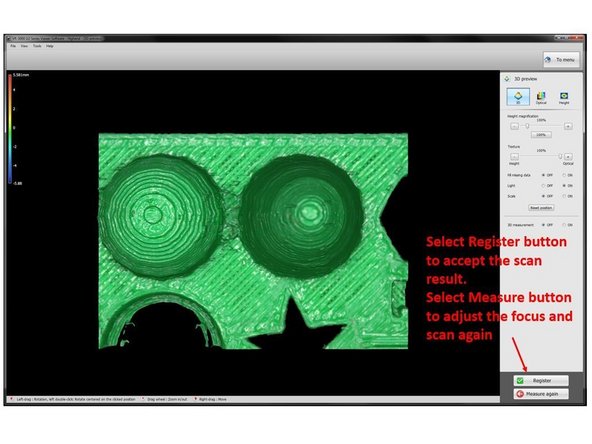
If you are not satisfied with the scan result, select Measure Again to restart the scan. If the scan is acceptable, select Register to accept the scan result
-
-
-
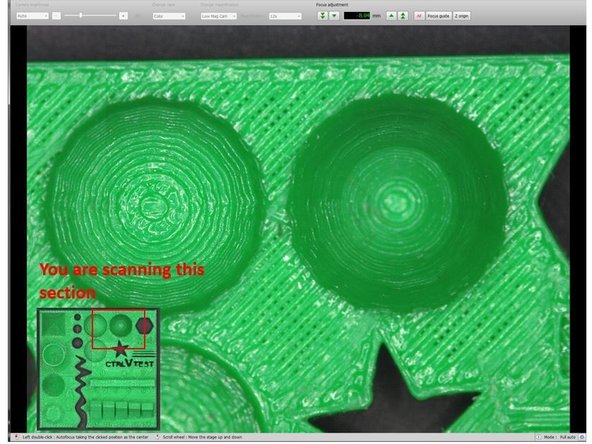
When you finish scanning the first section, the software will automatically move the window to scan the second section
-
Similar as the previous step, you will need to adjust the focus point to make sure that it is sufficient to scan the entire structure
-
When finish, select Register to accept the scan result
-
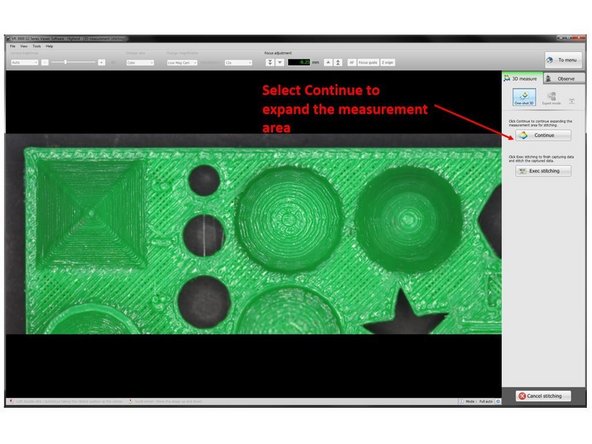
A new window will opene which ask for Continue or Exec stitching
-
Select Continue to move to the next stage
-
Don't select Exec stitching, you only select this when you finish the entire scan
-
-
-
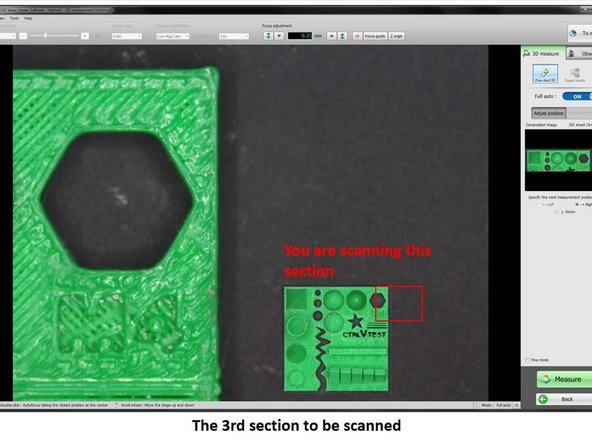
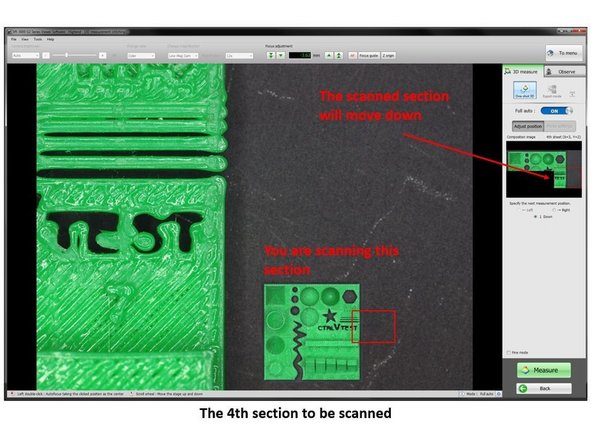
Continue scanning the third section of the part
-
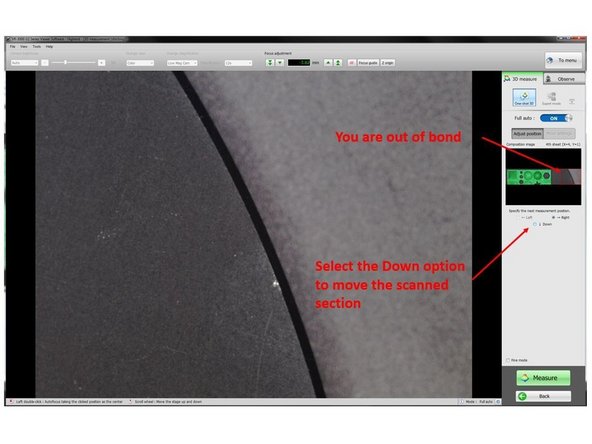
After finish the third scan and select continue to the next step, the scanning window will automatically move to the right which is outside the range of the part (See the second figure)
-
You will need to move the window down by selecting down option (See the second figure)
-
This will move the scanning window to scan the middle right section of the part (See the third figure)
-
Now you can continue running the scan for the rest of the structure. If you use 12x magnification (Default setting), you will need to run 12 scans in total
-
-
-
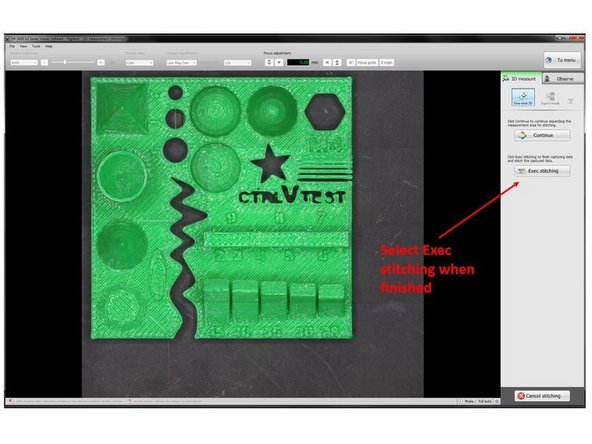
After you finish scanning the last section of the part (The 12th scan), on the window that asking to Continue or Exec stitching, select Exec stitching to start the stitching process (See the First Figure)
-
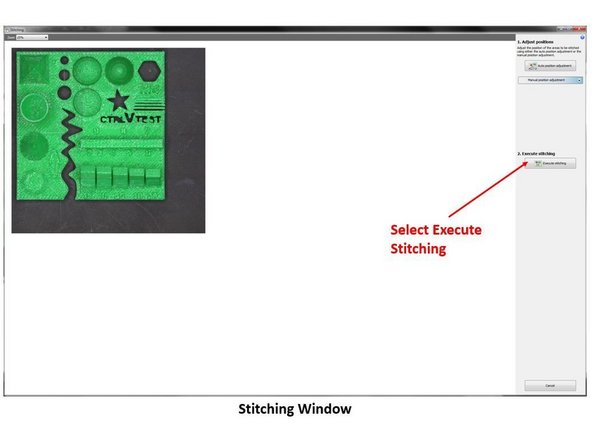
This will bring you to the stitching window. Here you need to select execute stitching (See the second figure)
-
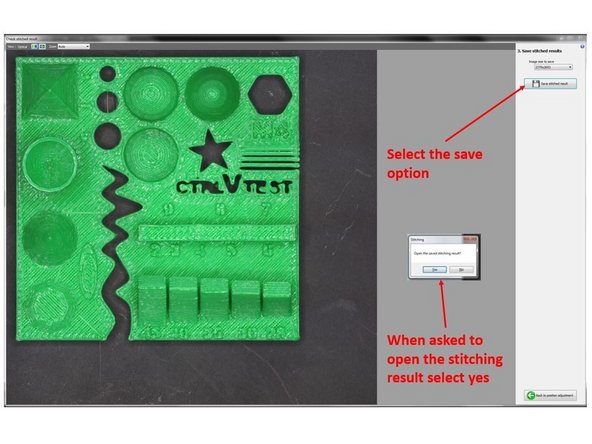
This will bring you to a save window. Select Save stitched result to save the result
-
A pop up will appear asking if you want to open the stitching result, select yes
-
-
-
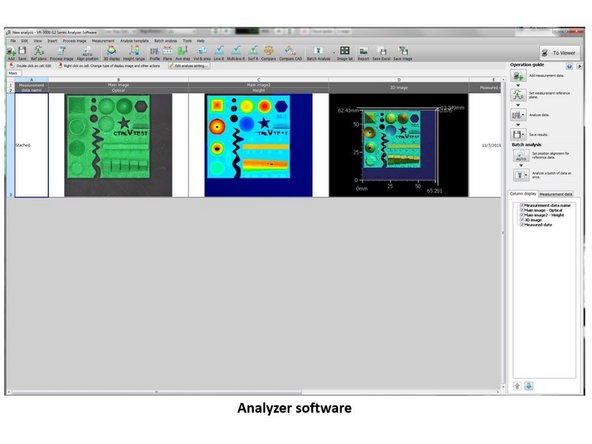
The analyzer software will automatically open where you can start analyzing the result
-
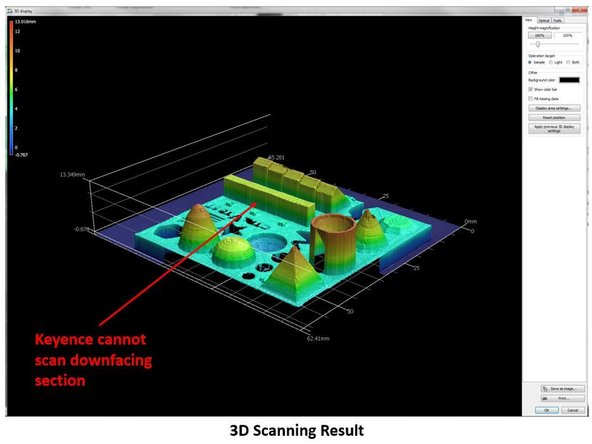
Analyzing the scan results, you will notice that Keyence cannot scan downfacing section. This is because Keyence works by using light source to scan the object from the top. Therefore, it will not be able to recognize downfacing surface
-
Please refer to the beginner guide for instruction on how to operate the analyzer software
-
The next two guide sections will explain how to perform part to part comparison and part to model comparison
-
-
-
The second section will explain how to use the Analyzer software to perform part to part comparison
-
In this exercise we will perform comparison between two dimes
-
First, scan the first dime using the Viewer Software
-
Second, open the scan result on the Analyzer software
-
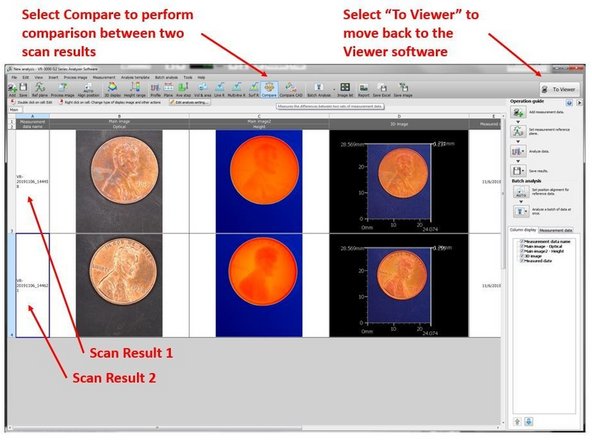
Third, select To View from the top right window to go back to the Viewer (See the figure)
-
Lastly, scan the second dime. You should have two scan results shown in the Analyzer software as shown in the figure
-
-
-
Select Compare from the top window to perform comparison between two scan results (See Figure from Step 8)
-
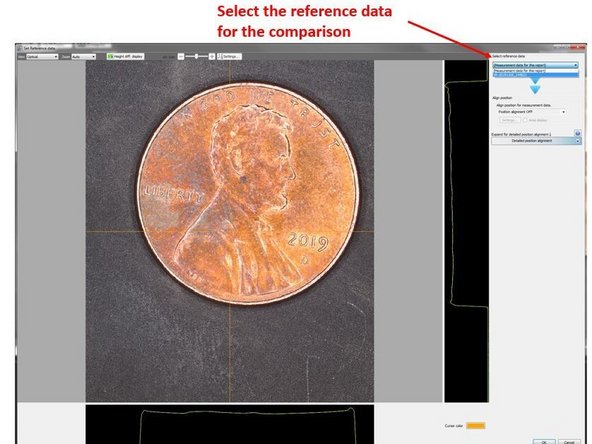
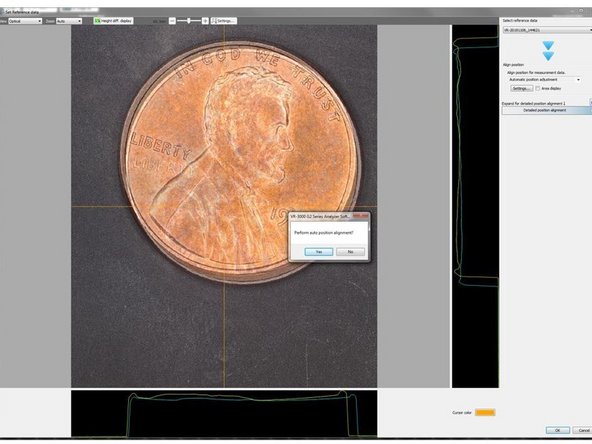
A new window will pop up where you can select which data will be used as the reference data for the comparison (See the first figure)
-
When asked if you want to perform auto alignment, select Yes
-
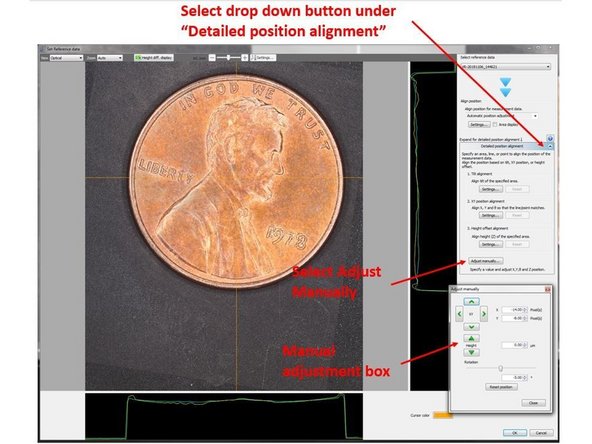
The auto-alignment is not perfect, you may need to perform manual alignment
-
To perform manual alignment, select drop down button under Detailed position alignment. Then select Adjust Manually (See the third figure)
-
A new box will open where you can manually adjust the location of the non-reference dime. You can move the dime in x- and y- axis or rotate it.
-
When finished, select the Ok button in the lower left window
-
-
-
A new window where you can analyze the comparison result will be displayed
-
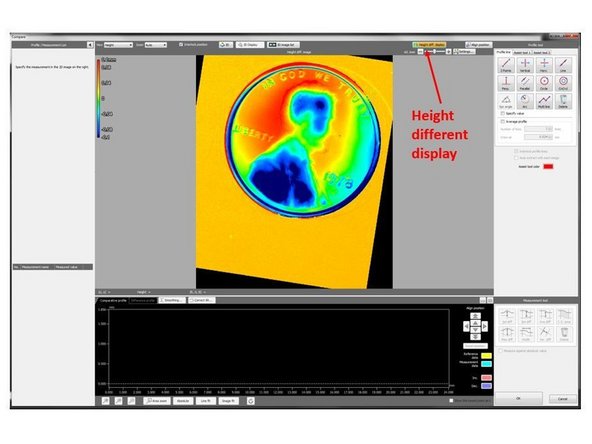
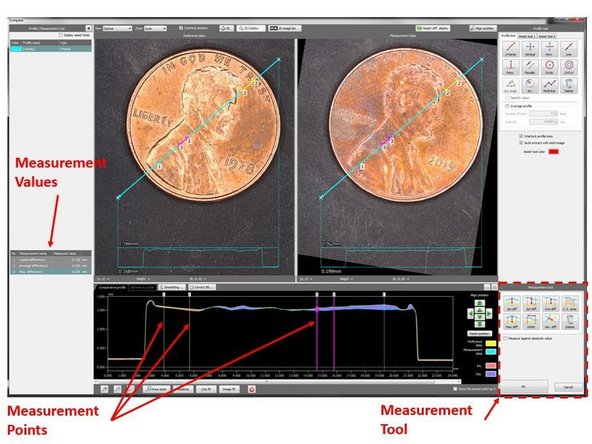
By turning on the High different display from the top left window (See the first figure), you can see a color map of the height difference between the two dimes
-
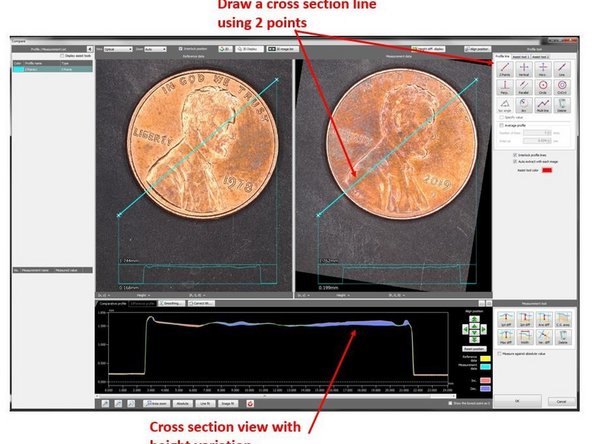
By drawing a cross section line across the part, you can get the cross section plot of the two dimes with the height different (See the second figure)
-
By using measurement tool from the bottom right window, you can measure the local or average height variation between the two dimes (See the third figure).
-
The measurement values are shown in the left window
-
-
-
You can go back to the analyzer window by selecting the Ok button on the lower right of the comparison window
-
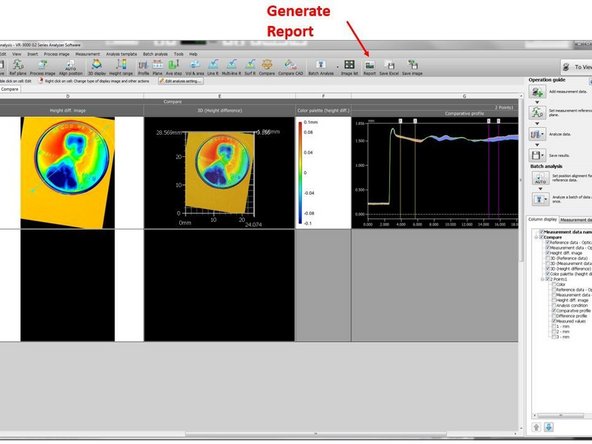
The comparison actions you did in the previous step will be shown in the analyzer window (See the first figure)
-
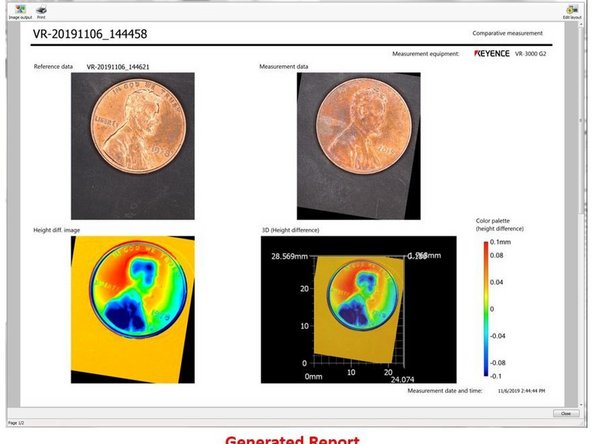
You can generate a summary report of the part comparison by selecting Generate Report from the top window (See the second figure)
-
-
-
The third section will explain how to use the Analyzer software to perform part to CAD model comparison
-
In this exercise we will perform comparison between the scan result of a UMD badge and its CAD model
-
You can download the CAD file of the badge in the link below: https://drive.google.com/open?id=1Ri-4lJ...
-
You can download the scan file of the badge in the link below: https://drive.google.com/open?id=159IE4u...
-
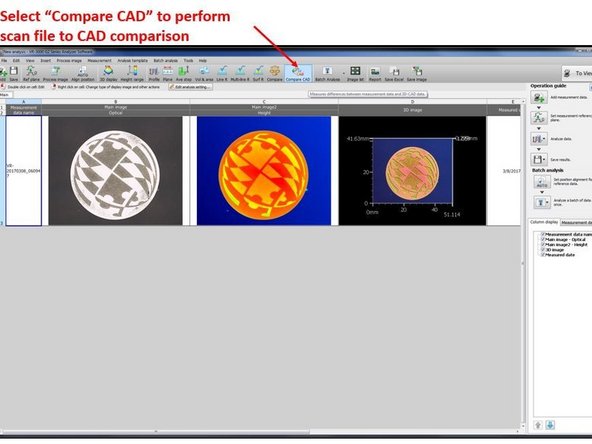
Select Compare CAD from the top window to perform scan file to CAD comparison (See the first figure)
-
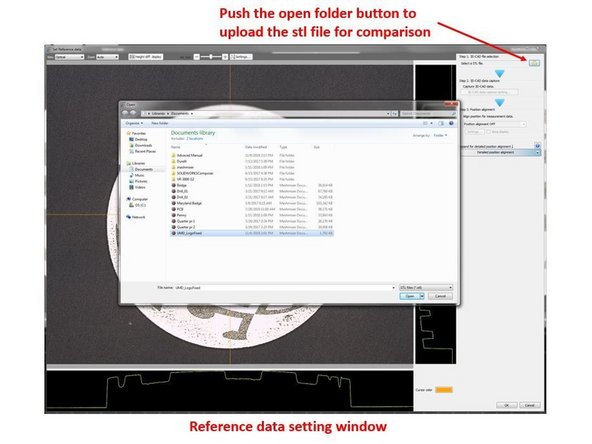
A Reference data setting window will open automatically
-
Push the open folder button from the top right window to upload the stl file for comparison (See the second figure)
-
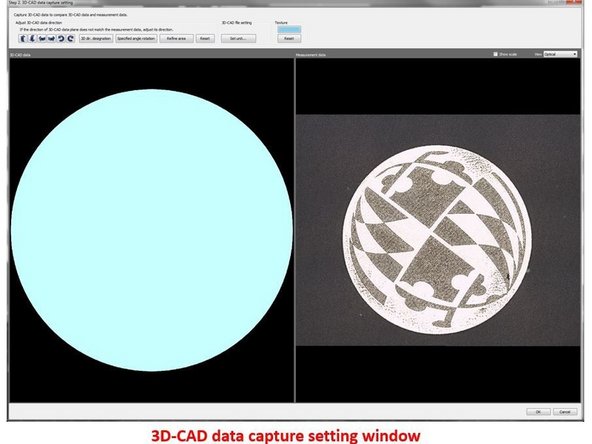
Thereafter, a 3D-CAD data capture setting window will open automatically (See the third figure)
-
-
-
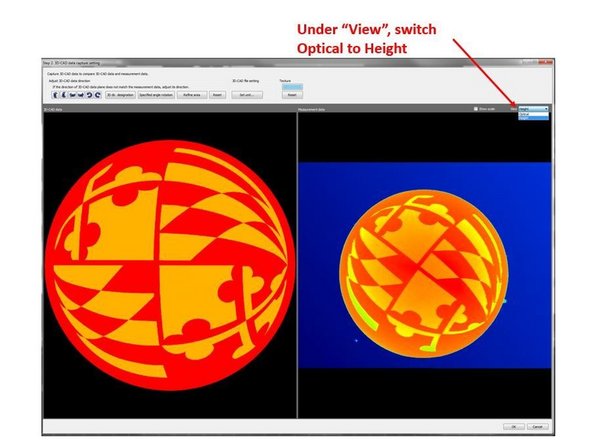
To show the feature of the 3D CAD data, under View, switch Optical to Height. (See the first figure)
-
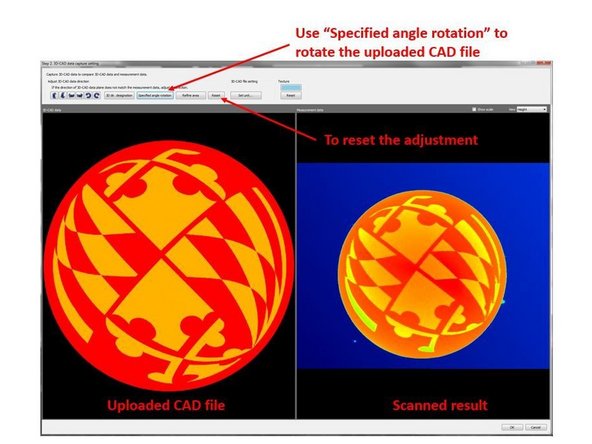
You can manually align the 3D CAD data with the scan result by using Specified angle rotation to rotate the uploaded CAD file
-
You will need to give the angle of rotation of the part
-
To reset the adjustment, select the Reset button
-
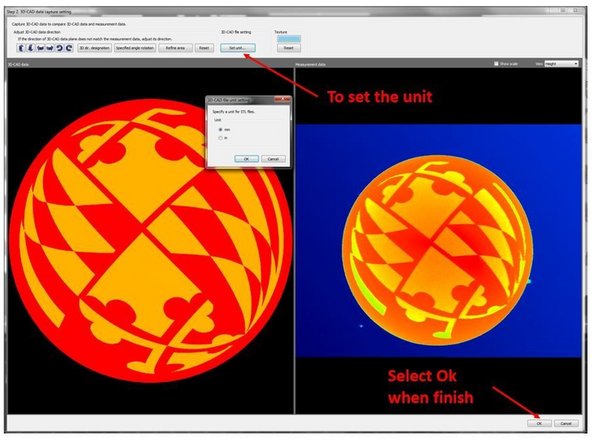
The default unit setting is at SI. You can also specify the unit of the stl file by selecting Set unit... (See the third figure)
-
When finish select the Ok button in the lower right
-
-
-
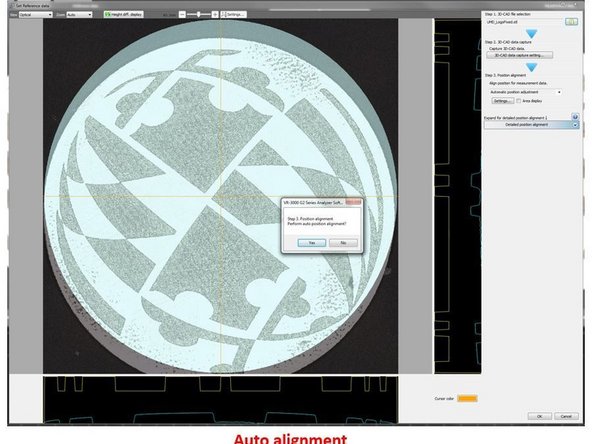
After selecting Ok from the previous step, you will be back at the Set reference data window (See the first figure). You will be asked, if you want to perform auto alignment. Select yes
-
You can see if the CAD model is well align with the part by looking at the window and the cross section view.
-
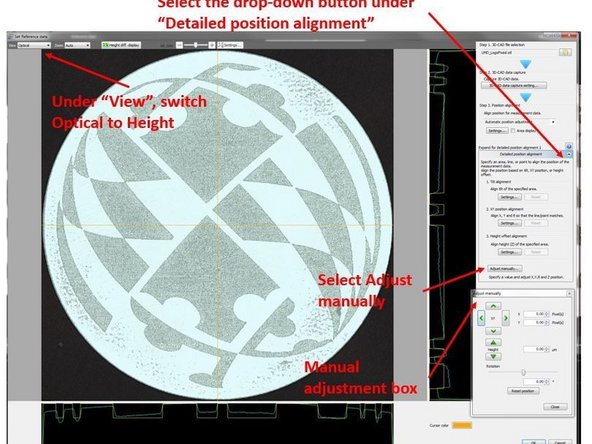
To show the feature of the 3D CAD data, under “View”, switch Optical to Height. (See the second figure)
-
The auto-alignment is not perfect, you may need to perform manual alignment
-
To perform manual alignment, select drop down button under Detailed position alignment. Then select Adjust Manually (See the second figure)
-
A new box will open where you can manually adjust the location of the non-reference dime. You can move the dime in x- and y- axis or rotate it.
-
When finished, select the Ok button in the lower left window
-
This will bring you to the 3D-CAD comparative window (See the third figure)
-
-
-
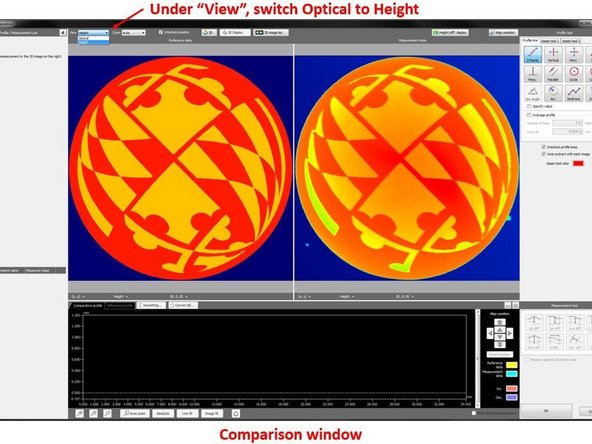
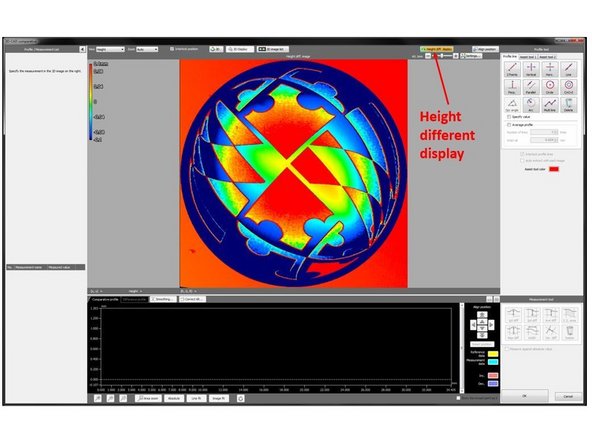
By turning on the High different display from the top left window (See the first figure), you can see a color map of the height difference between the scan result and the CAD model
-
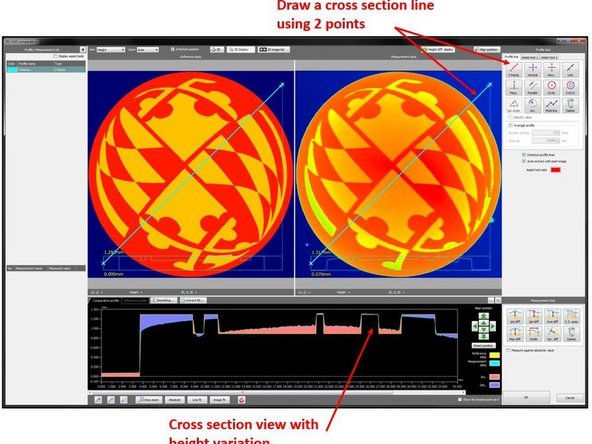
By drawing a cross section line across the part, you can get the cross section plot of both the scan result and the CAD model with the height different between them (See the second figure)
-
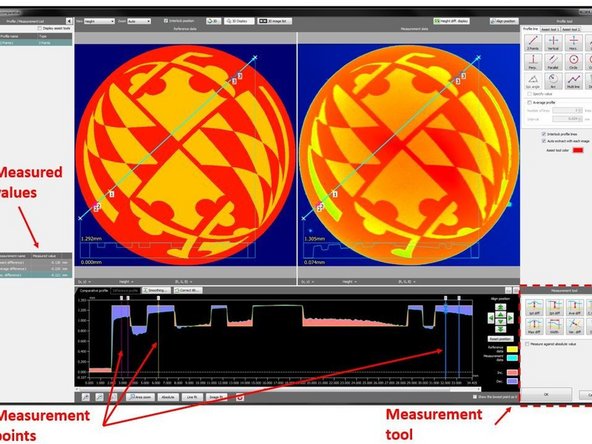
By using measurement tool from the bottom right window, you can measure the local or average height variation (See the third figure)
-
The measurement values are shown in the left window
-
-
-
You can go back to the analyzer window by selecting the Ok button on the lower right of the comparison window
-
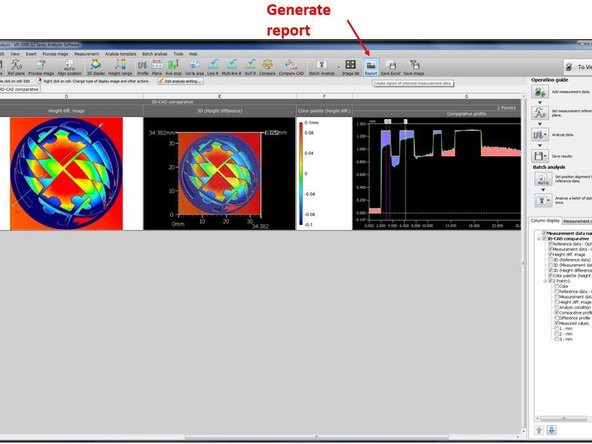
The comparison actions you did in the previous step will be shown in the analyzer window (See the first figure)
-
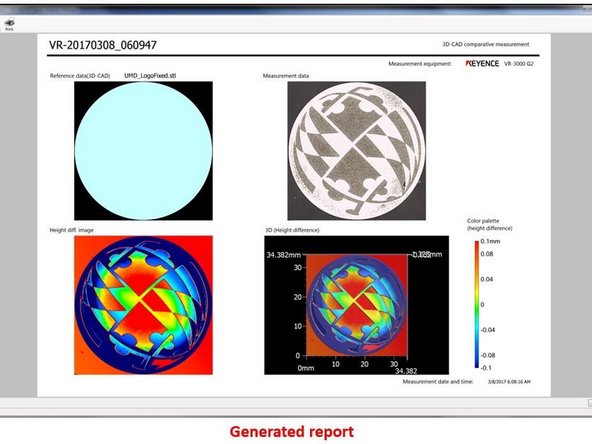
You can generate a summary report of the part comparison by selecting Generate Report from the top window (See the second figure)
-


Congratulation you have learn the advance skill needed to operate Keyence VR-3200 3D scanner
Congratulation you have learn the advance skill needed to operate Keyence VR-3200 3D scanner
Cancel: I did not complete this guide.
4 other people completed this guide.