
-
-
This tutorial explains how to perform a comparison between two scan results or between a scan results and a CAD model
-
To perform the comparison, the scan results need to be exported as an .stl file (Please refer to the beginning tutorial for each scanner for instruction on how to export the scan results)
-
For the case of comparison with the CAD model, the CAD model also needs to be exported as an .stl file
-
For the comparison, two software are used:
-
Geomagic Design X is used for aligning the two .stl files
-
CloudCompare is used for comparison between the two align files
-
Geomagic Design X software is available in the scanner desktop and laptop
-
CloudCompare software can be download for free from the internet
-
-
-
The first step is to use Geomagic Design X software for aligning the two .stl files
-
You can import the .stl files by using the Import feature under Home as shown in the first figure
-
Select both .stl files and select Import Only as shown in the second figure
-
The two imported data files are shown in the top left window as shown in the third figure
-
-
-
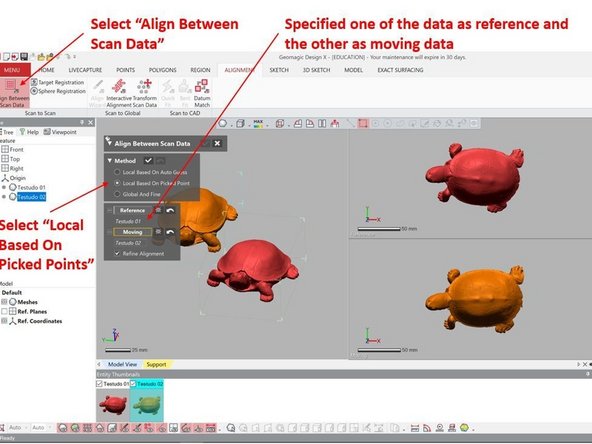
Select Align Between Scan Data under Alignment to start the alignment process (See the first figure)
-
For the alignment method, select Local Based on Picked Points
-
Specify one of the data as reference and the other as moving data
-
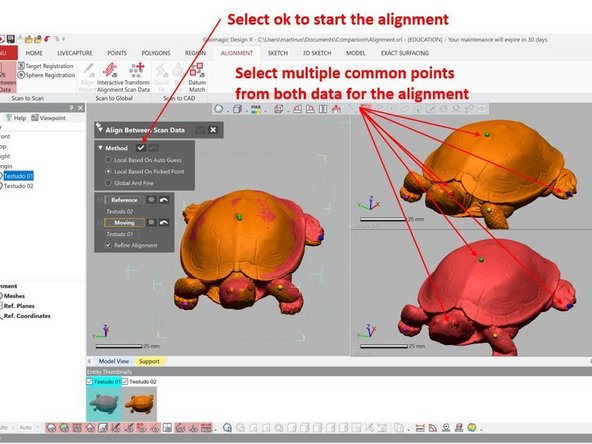
Select multiple common points from both data for the alignment as shown in the second figure
-
Select Ok (Under method) to start the alignment (See the second figure)
-
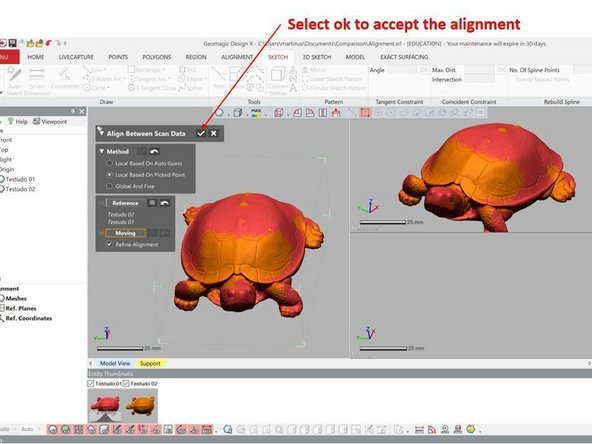
Checked the alignment result to make sure that they are well aligned. Otherwise, repeat the process by adding more reference points
-
Select Ok (Under Align Between Scan Data) to accept the alignment (See the third figure)
-
-
-
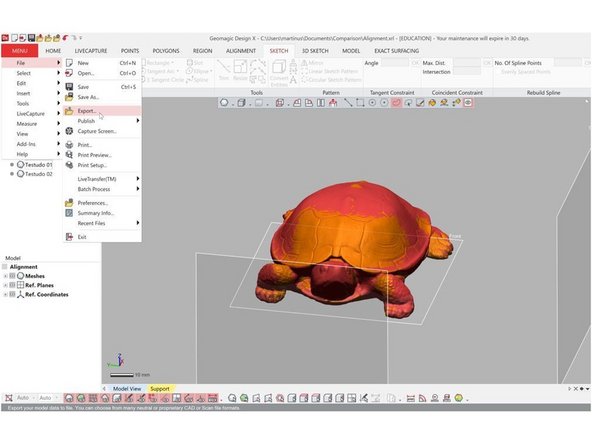
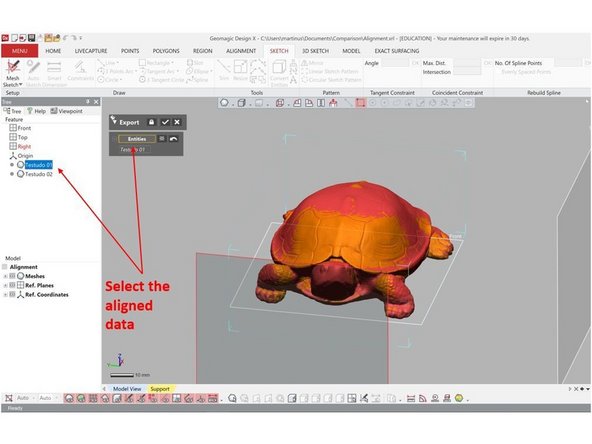
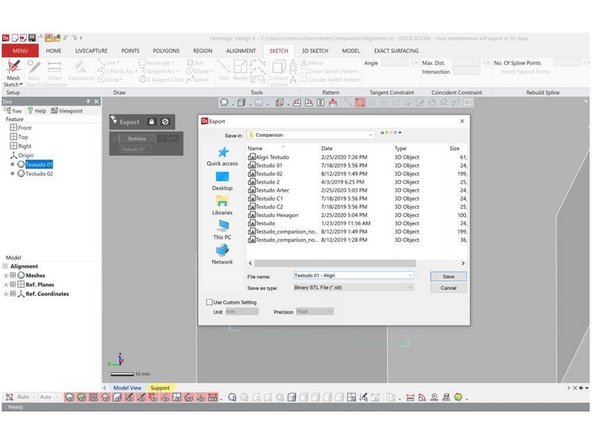
The aligned data need to be imported back into .stl file by using the Export feature under Menu > File > Export (See the first figure)
-
Select the aligned data. You need to export the data one by one, so only select one of the data (See the second figure)
-
Select .stl as the output file type (See the third figure)
-
Repeat the process for the second file
-
-
-
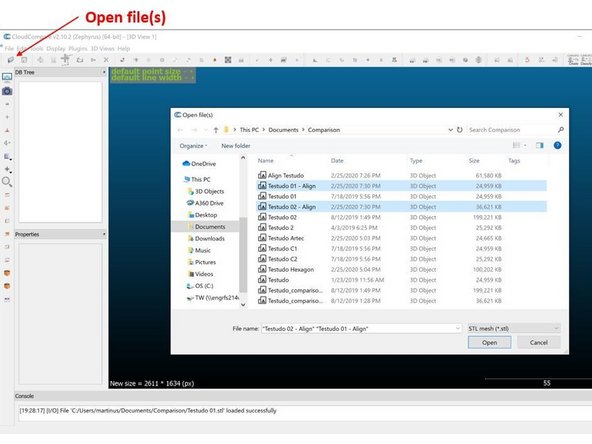
Run the CloudCompare software to start the part comparison
-
Run Open File(s) to import the aligned .stl files (See the first figure)
-
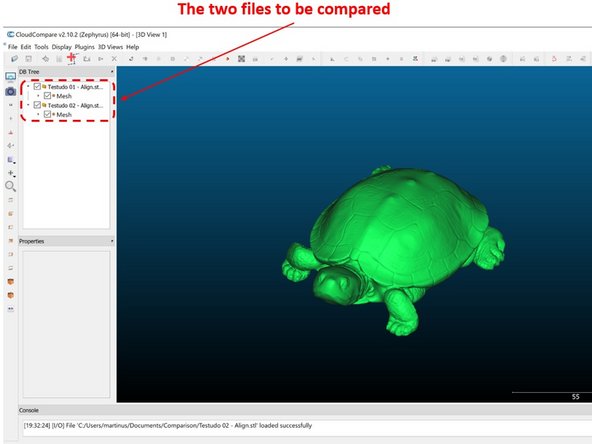
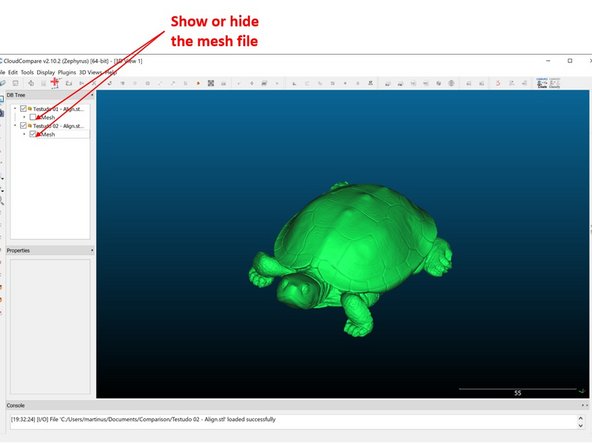
The two files you want to compare are shown in the top left window (See the second figure)
-
You can show or hide one or both files by checking or unchecking the mesh as shown in the third figure
-
-
-
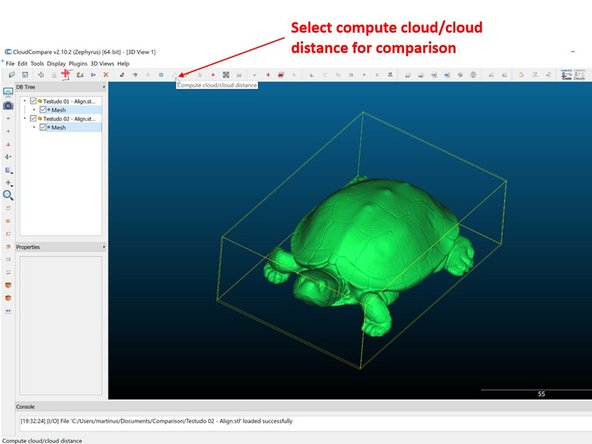
Select compute cloud/cloud distance to start the comparison process as shown in the first figure
-
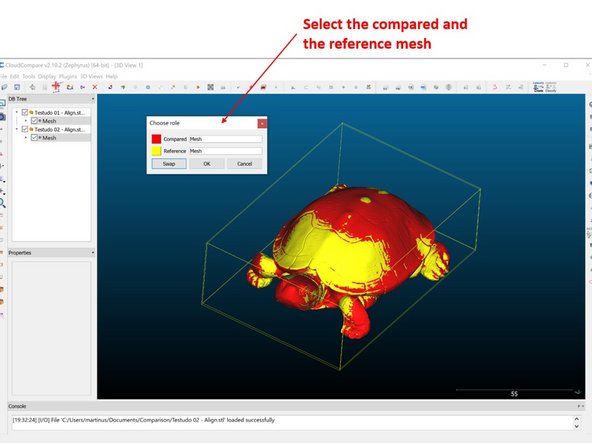
Select one of the mesh files as the compared mesh and the other as the reference mesh as shown in the second figure
-
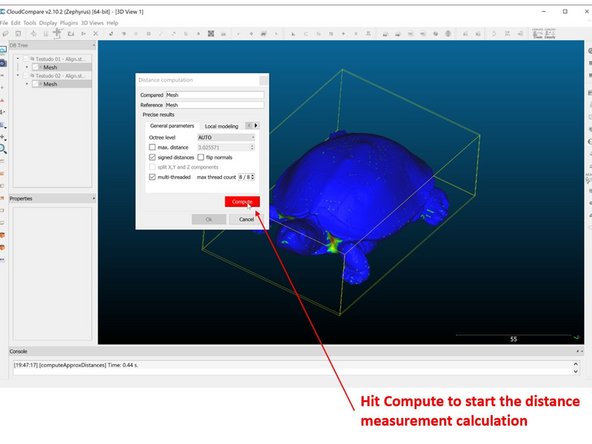
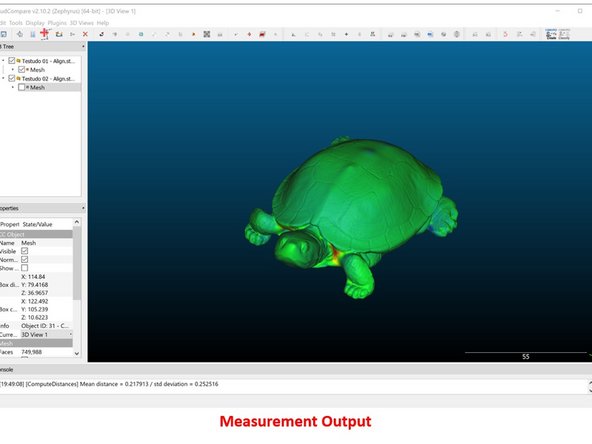
Hit Compute to start the distance measurement calculation as shown in the third figure
-
-
-
The measurement result is shown in the first figure as the distance difference between the two mesh
-
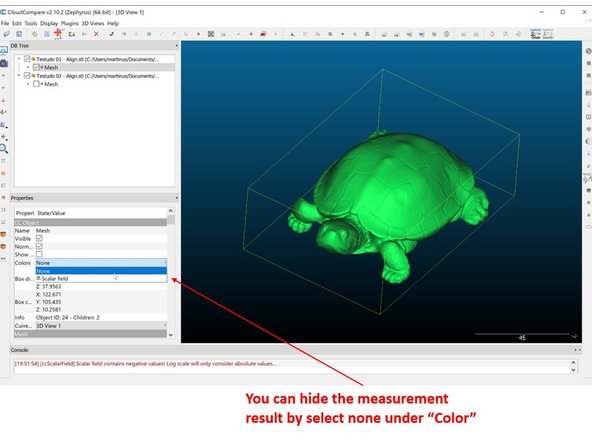
You can hide the measurement result by select none under Color (Under the compare mesh file) as shown in the second figure
-
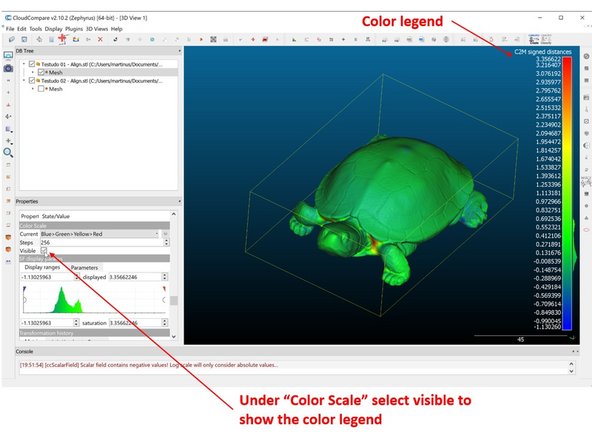
To show the color legend select visible under Color Scale as shown in the third figure
-
-
-
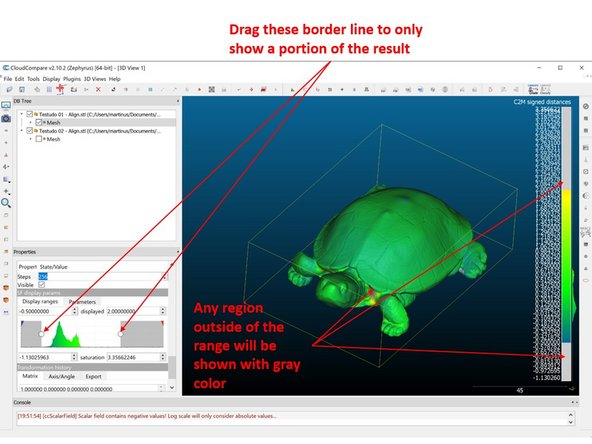
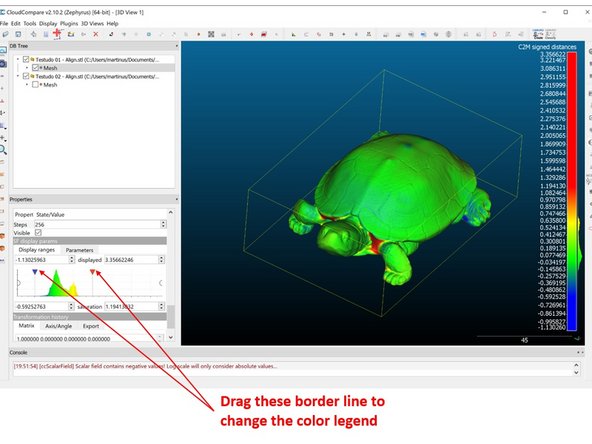
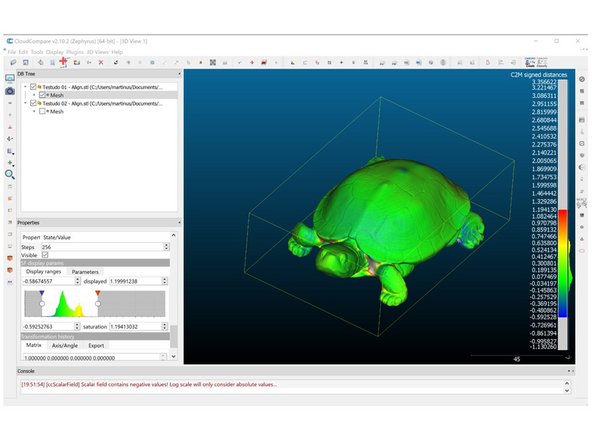
You can drag the borderline (The one with circular symbol) to only show a portion of the result as shown in the first figure
-
The region outside of the range will be shown with gray color
-
You can drag the borderline (The one with red and blue triangle symbol) to change the color legend as shown in the second figure
-
The region outside of the range will be shown with either red or blue color
-
You can also drag both borderlines at the same time as shown in the third figure
-
-
-
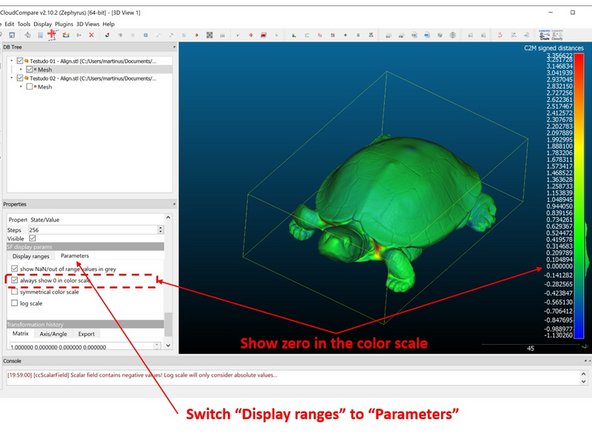
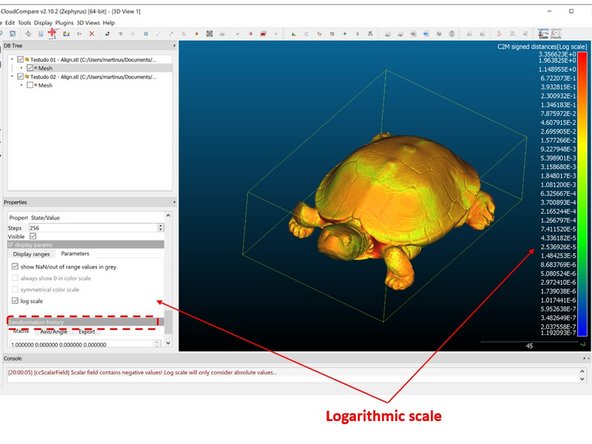
Under SF display params, switch Display ranges to Parameters (See the first figure)
-
Select always show 0 in color scale to show zero in the color scale as shown in the first figure
-
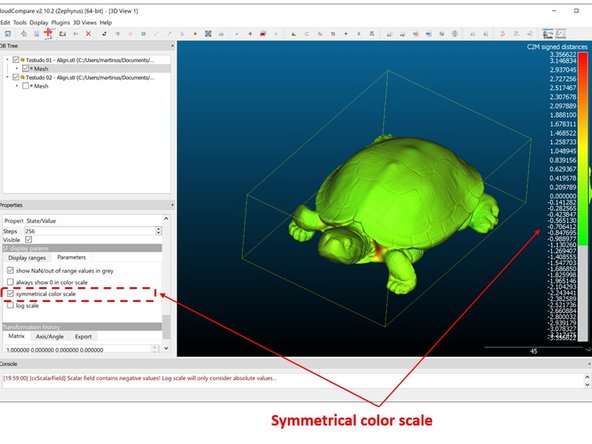
Select symmetrical color scale to have a symmetrical color scale in both positive and negative distance as shown in the second figure
-
Select logarithmic scale to have a symmetrical color scale in both positive and negative distance as shown in the second figure
-
-
-
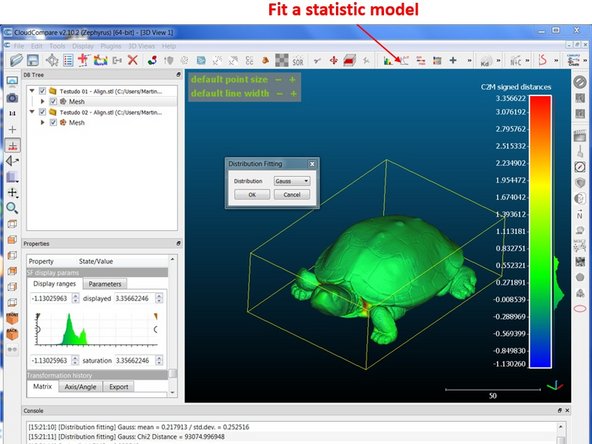
In CloudCompare, you can quantify the difference between the two scans
-
On the top window, select Fit a statistic model (See the first figure)
-
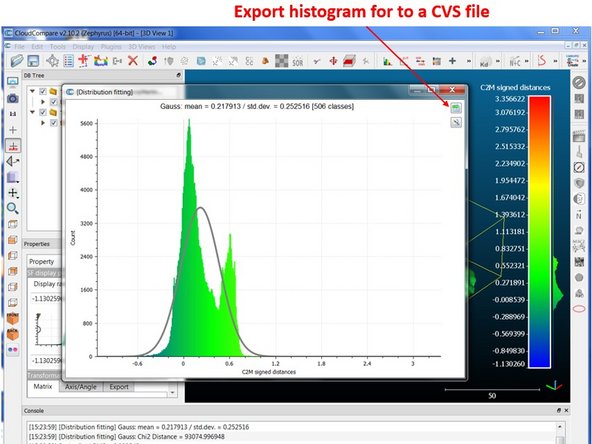
A plot showing the distribution of the difference between the two scans will pop up as shown in the second figure
-
In addition to the distribution, the plot also showed the Mean and Standard Deviation
-
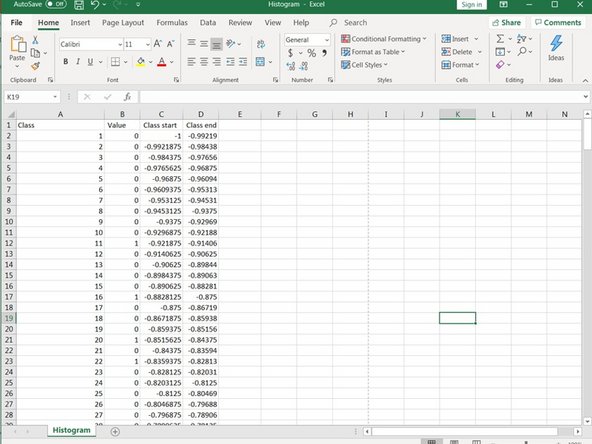
You can also export the histogram for to a CVS file (Excel file) as shown in the third figure
-


Congratulation you have learned the skill to perform a comparison between two scan results or between scan result and the CAD model
Congratulation you have learned the skill to perform a comparison between two scan results or between scan result and the CAD model