Tools
Parts
No parts specified.
-
-
Open your browser and browse to https://analytics.umd.edu
-
UMDashboards is best viewed in the Google Chrome browser.
-
-
-
Click the red UMDashboards button in the header of our website to open UMDashboards.
-
You will be redirected to CAS. Log in & complete your Duo push to continue.
-
After you authenticate through CAS, you may be presented with an interstital page asking whether you want to view dashboards in HTML or Flash.
-
Choose Enable Flash to continue.
-
Choose Allow in the following prompt that appears in the top left.
-
You will now be logged in to UMDashboards. Depending on your settings, you will see one of two landing screens.
-
-
-
Depending on your settings, you will either see:
-
1. The Startup Dashboard you have configured in your user settings or that has been assigned to your user profile by a member of our team.
-
2. The default iDashboards landing screen (which is blank).
-
-
-
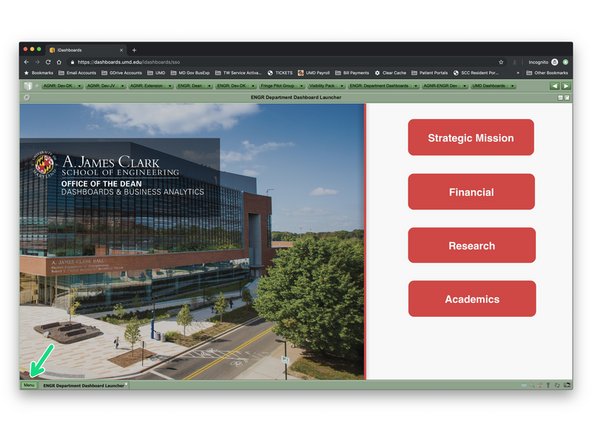
In the example, I have chosen to set the ENGR Department Dashboard Launcher as my Startup Dashboard.
-
-
-
While on the dashboard you would like to set as your Startup Dashboard, mouse over to the lower left corner of the screen and click the Menu button.
-
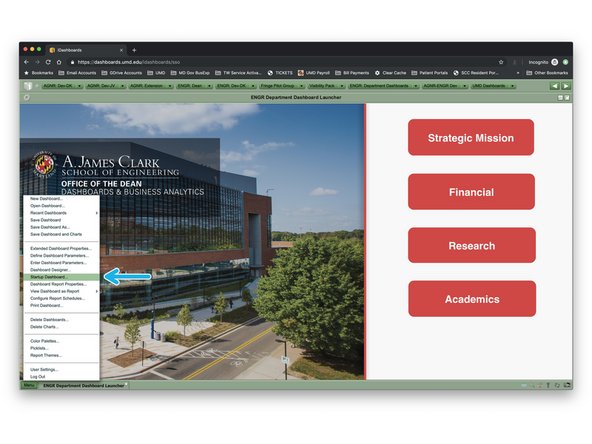
Choose the Startup Dashboard... option in the corresponding menu.
-
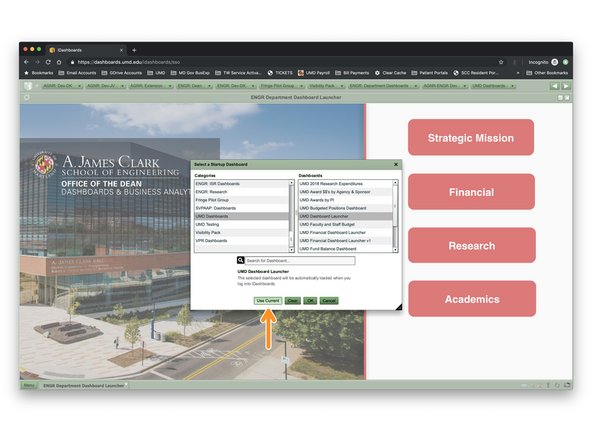
Click the Use Current button in the corresponding pop-up window.
-
-
-
Close the tab you are in in Google Chrome and re-open UMDashboards from our website (https://analytics.umd.edu).
-
UMDashboards should now open to the dashboard you set as your Startup Dashboard in the prior step.
-
Having trouble? Contact dashboards@umd.edu.
-
You have successfully set a Startup Dashboard for your user profile.
You have successfully set a Startup Dashboard for your user profile.


